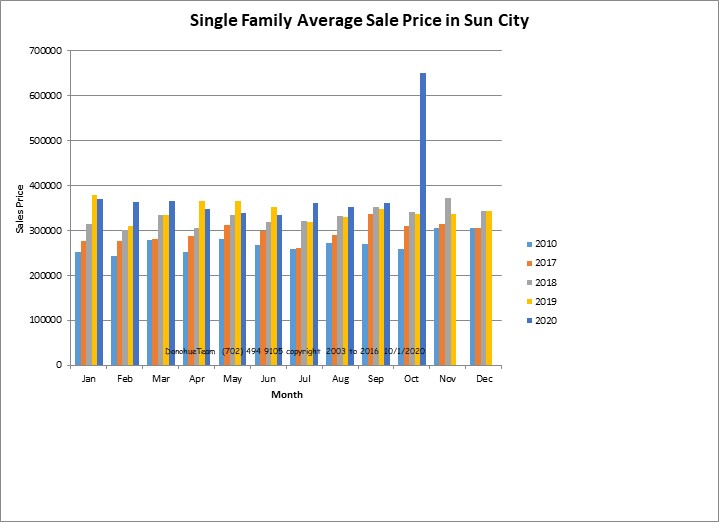
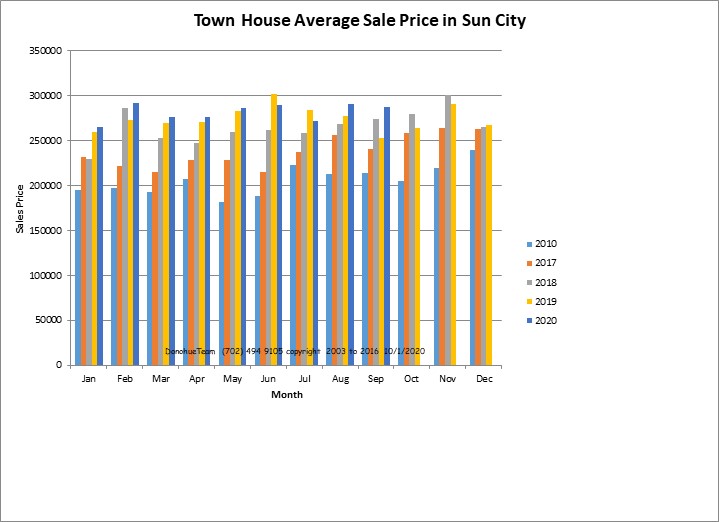
These absolute prices are difficult to interpret. You mix size in with value. So a good part of the variability is the size of the homes moving around.
Overall though it is pretty clear that value moved up in the first half of the year and then flattened in the second half. This pattern is occurring in many of the individual models where the price curve has clearly flattened or turned a little downward.